
|

|

|

|

|

|

|

|

|

|

|
 |
Interconnects |
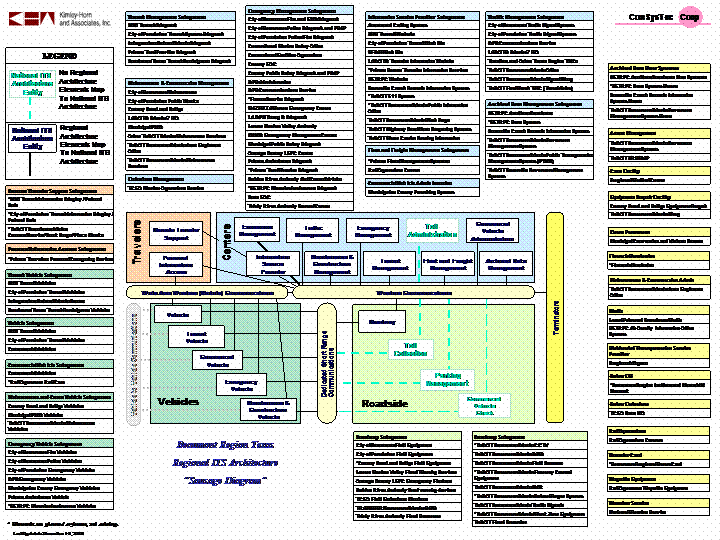
One of the most recognized architecture representations is a "Sausage Diagram" that shows the systems and primary interconnects in the Region. The graphic below is the Sausage Diagram for the Beaumont Regional ITS Architecture. It shows the entire existing, planned, and future ITS inventory associated with the National ITS Architecture subsystems (rectangles), and terminators (rounded rectangles). Click on the graphic to download a PDF version.

 Web Spinner Technology.